Backtesting a strategy
Run NinjaTrader's Strategy Analyzer yourself and read the result.
R2 backtests its books for you — press BACKTEST on the Summary page and it drives NinjaTrader's Strategy Analyzer, imports the results and re-sizes your accounts. You never have to do this by hand.
This guide is for when you want to look for yourself: to check a number R2 is showing you, to try a book on a different instrument, or to see how one behaved in a particular year.
It assumes you have never opened the Strategy Analyzer. Nothing here can place a real order — a backtest only ever replays history.
Contents
1. Opening the Strategy Analyzer
In NinjaTrader's Control Center, click New → Strategy Analyzer.
A window opens with results on the left and a Settings panel on the right. Everything you need is in that panel.
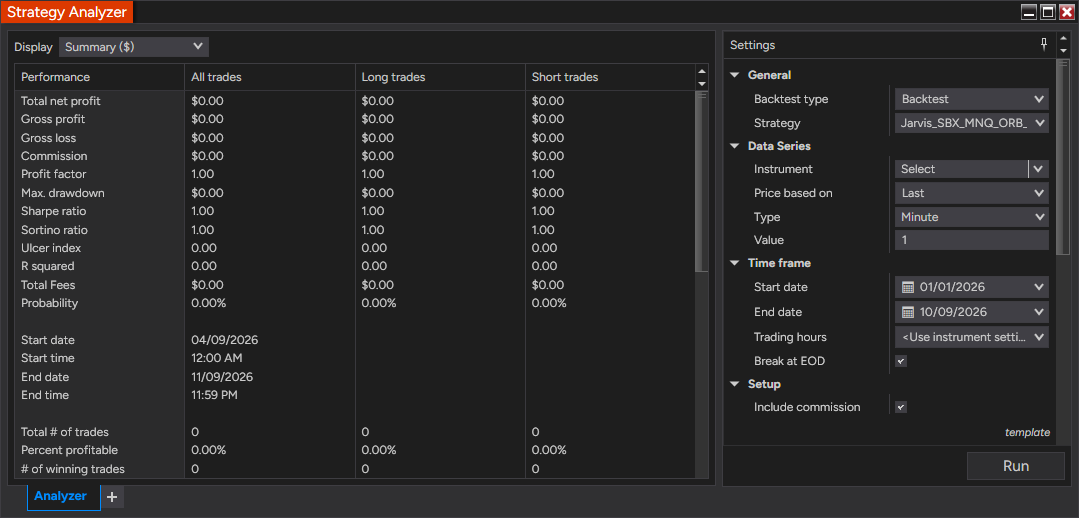
If the Settings panel is missing, click the small pin icon at its top right, or widen the window — it hides when the window is narrow.
2. The settings, one at a time
Work down the panel in order. Each heading below matches a heading in NinjaTrader.
General
Backtest type — set this to Backtest.
The other options do different jobs. Optimization runs the strategy hundreds of times with different settings to find the best ones; Walk Forward does that repeatedly through time. Both are useful, and both take a long time. For "how did this book do?", you want Backtest.
Strategy — choose the book from the list. R2's books all begin ORB. The one on most of
your accounts is ORBMicroIncomeAllV2.
Data Series
Instrument — click Select and pick the contract. Use the front month — the one
NinjaTrader is currently quoting, NQ 09-26 at the time of writing. This matters more than it
looks: NinjaTrader holds no price data for a contract that is not current, so picking an old
one produces a backtest with no trades in it and no explanation.
R2's books trade several instruments at once — they add ES, YM, MES, MNQ and MYM themselves. The instrument you pick here is just the chart they hang on. R2 always uses NQ.
Price based on — Last. (Not Bid or Ask: you want traded prices.)
Type — Minute.
Value — 5. Together with Type that means a 5-minute chart, which is what R2's books are built for. A different value will produce different trades, and they will not be comparable with anything R2 shows you.
Time frame
Start date — as far back as your data goes. NinjaTrader downloads history the first time you ask for it, so the first run over several years is slow; after that it is quick.
End date — today.
Trading hours — leave it on <Use instrument settings>.
Break at EOD — ticked. This tells NinjaTrader to treat each session separately, which is how these books work: they open positions during the day and are flat by the close.
Setup
Include commission — ticked. A backtest without costs flatters every strategy, and R2's own figures include them, so leaving this off is the quickest way to get numbers that disagree with the dashboard.
3. The settings R2 itself uses
If you want a run you can compare directly with the dashboard, match these exactly. They are the settings R2 sends to the Analyzer:
| Setting | Value |
|---|---|
| Backtest type | Backtest |
| Instrument | NQ front month (e.g. NQ 09-26) |
| Price based on | Last |
| Type | Minute |
| Value | 5 |
| Trading hours | Use instrument settings |
| Break at EOD | ticked |
| Include commission | ticked |
| Account | Sim101 |
| Slippage | 0 ticks |
Anything else and you are measuring a different thing — which is fine, as long as you know that is what you are doing.
4. Running it
Press Run, bottom right.
A first run over several years can take a few minutes, mostly spent downloading history. NinjaTrader stays responsive; the Analyzer fills in when it finishes.
This does not touch your accounts. A backtest replays stored prices. It places no orders and cannot reach a funded account. R2 enforces the same rule from its side: a backtest result is never allowed to come from anything but Sim or Backtest.
5. Reading the results
The left pane fills with a summary. The ones worth your attention:
Total net profit — after commission, because you ticked that box.
Profit factor — gross profit divided by gross loss. Above 1.0 makes money; R2 treats anything under 1.0 on a rolling basis as drift and flags the book.
Max. drawdown — the deepest fall from a high. This is the number that decides whether a prop account survives, and it matters far more than the profit.
Total # of trades — the sample. R2 refuses to size an account on a book with fewer than 150 trades, or on one whose history covers less than 250 sessions (about a year). A beautiful curve over forty trades is a story, not evidence.
Percent profitable — interesting, and less important than it looks. A book that wins 40% of the time with large winners beats one that wins 70% with small ones.
Change Display at the top left to see the equity curve, the trade list, and the periodic breakdown.
Getting the trades out
Right-click the results → Export → and save the trade list. R2 reads exported trades from:
Documents\NinjaTrader 8\dashboard\backtest\trades\
named sa__<StrategyName>.jsonl. In practice you will not need to do this by hand — R2's
own BACKTEST button writes them there itself, which is the supported path.
6. Why your numbers may differ from R2's
All of these are normal, and each has a reason:
R2 shows fewer trades than your run. R2 discards any run where a position was held for more than ten hours — these books flatten every session, so a longer hold means the run itself is broken, usually a missing data series.
R2's profit is lower. Commission. Check the box.
R2's "days" are different. R2 reports in trading days the book was active, then converts to calendar sessions for the estimate on the cards. The Analyzer reports plain dates. A book that trades one session in four takes four times as long in real life as its trade count suggests — which is exactly why R2 makes that conversion.
Your run has no trades at all. Almost always the contract month: you picked a contract NinjaTrader has no data for. Use the front month.
Your drawdown is smaller than R2's. R2 measures drawdown at your account's size, not at one contract, and against your firm's trailing floor rather than the peak of the curve.
7. Common problems
"Strategy is not in the list." It has not been compiled. Press COMPILE NT8 on R2's Summary page, or open New → NinjaScript Editor in NinjaTrader and press F5.
It runs but every result is zero. Check the instrument is the front month and the Type is Minute / Value 5.
It takes forever. The first run downloads history. Leave it; the second is fast.
"Error on calling OnBarUpdate" in NinjaTrader's log — the strategy hit a bar it did not expect, usually a data series with no data. Check the instrument again.
The numbers move between runs. They should not. If they do, you are changing something between runs — most often the date range, or the tick-replay setting.